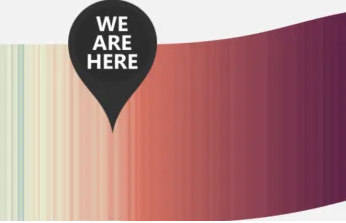
Last year, a visualization that turned data on our planet’s temperature into a gradient of colorful stripes made a splash by showing how severely the world has warmed to-date. Now, a new visualization riffs on that by showing what the future holds...Click on the link below to read the full article.